Quartz microanalysis using SIMS

By: Mai Sas

PhD candidate Mai Sas, working with Dr. Phil Shane, has flown over to Japan in 2018 to analyze some of her samples using a CAMECA 1280-HR multi-collector secondary ion mass spectrometer (MC-SIMS), a high-resolution instrument not currently present in New Zealand. Mai is looking at oxygen isotopic compositions of quartz crystals from rhyolitic deposits from the Okataina Volcanic Centre, a dormant caldera system in the Taupo Volcanic Zone of North Island, New Zealand. Mai is trying to understand if, and how, oxygen isotopic compositions fluctuate at the Okataina magmatic systems, and what implications that may have for this, and other, rhyolitic volcanic centres. She completed her analyses at the Isotope Imaging Laboratory (IIL), which is part of the Creative Research Institution (CRIS) at Hokkaido University in Sapporo, Japan, an excellent facility with several SIMS instruments. The images below follow include a glimpse at the initial sample preparation stages, as well as which analytical instruments were used at IIL.


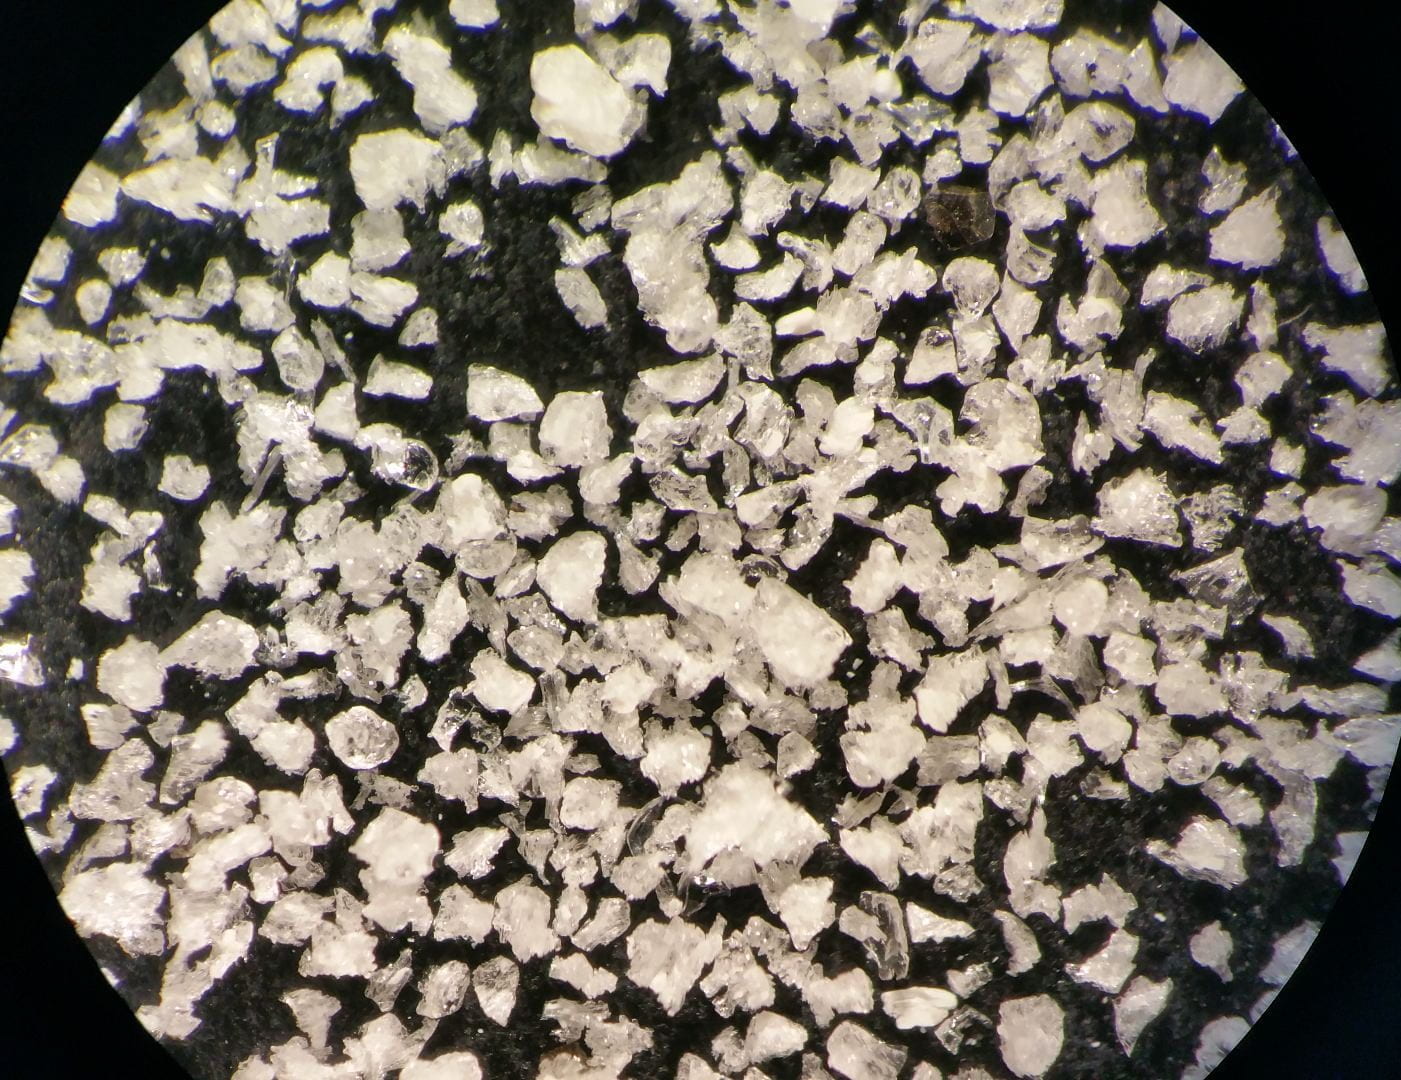
Microscopic (low-magnitifcation) image of the crushed pumice sample, showing a mixture of minerals and volcanic glass. The majority of the minerals consist of plagioclase and quartz, with some ferromagnesian minerals such as biotite, Fe-Ti oxides, and orthopyroxene. Each mineral had to be examined carefully to make sure it is the desired mineral, as plagioclase, quartz and fresh volcani glass can all appear very similar. Helpful identification tools include crystal form and mineral cleavage or fracture.


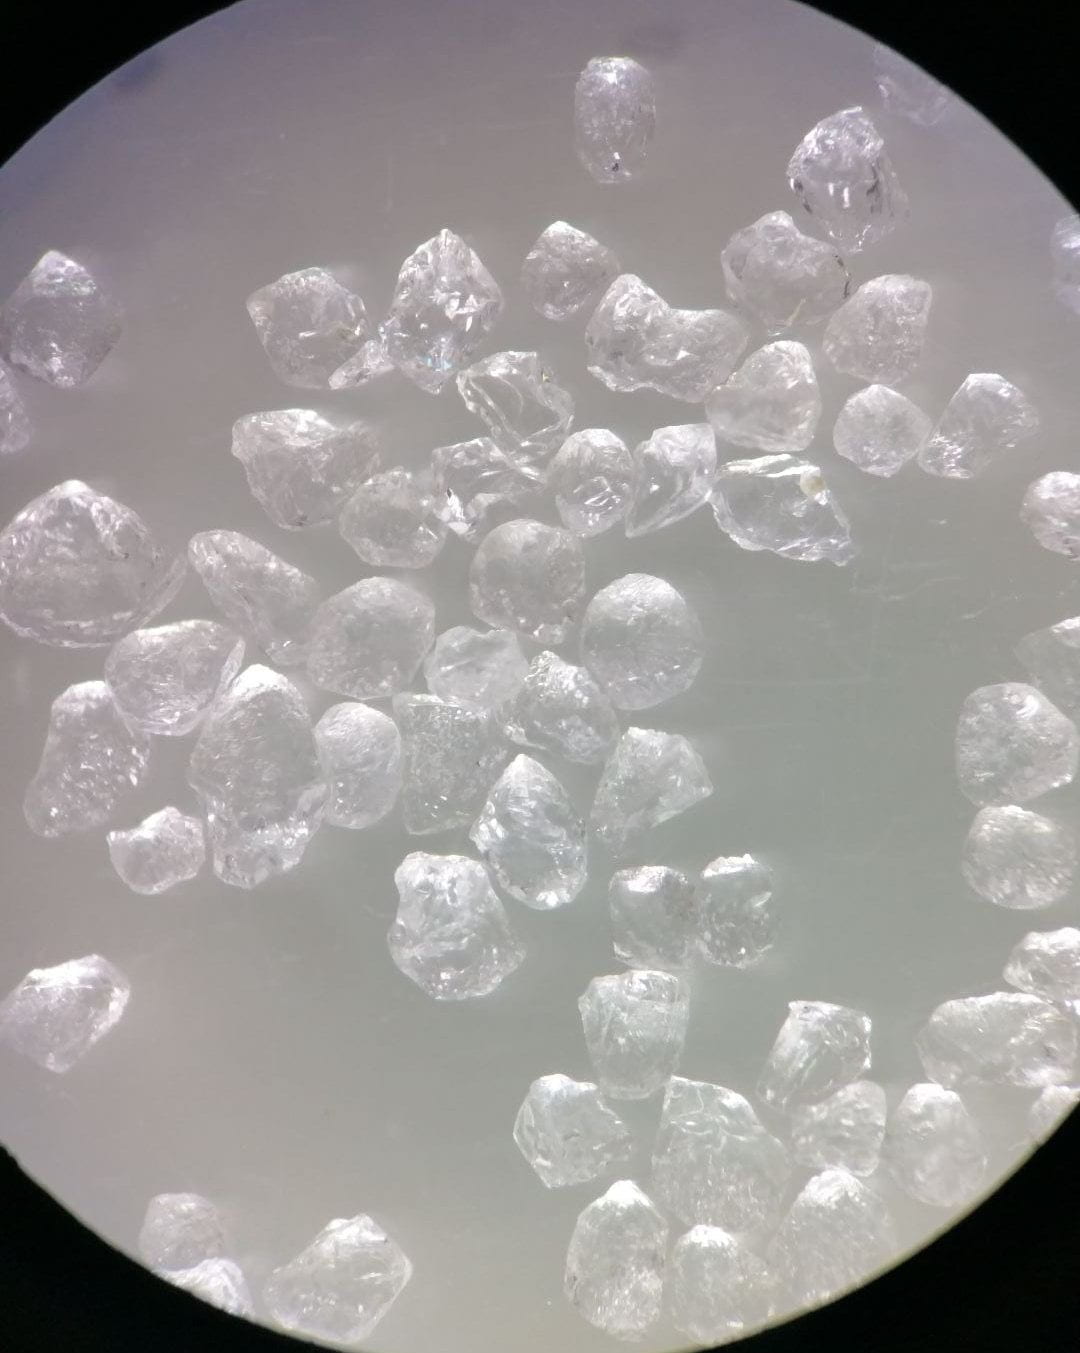
Microscopic (low-magnitifcation, but higher than previous) image of the picked quartz crystals from one of the tephra samples.


Microscopic (higher-magnitifcation) image of a picked quartz crystal with an inclusion.


CAMECA 1280-HR MC-SIMS. The SIMS instrument takes up the space of a large room and is situated in a clean lab, with full body suits and air blasts required prior to lab entry. This ensures quality analysis and prevents contamination.


CAMECA 1280-HR MC-SIMS sample dock, where the samples sit under vacuum prior to analysis.


CAMECA 1280-HR MC-SIMS working station, with the SIMS located in the room with the glass windows.


CAMECA 1280-HR MC-SIMS high-spatial resolution analysis of a quartz crystal. Spot size is ~20 microns in diameter.


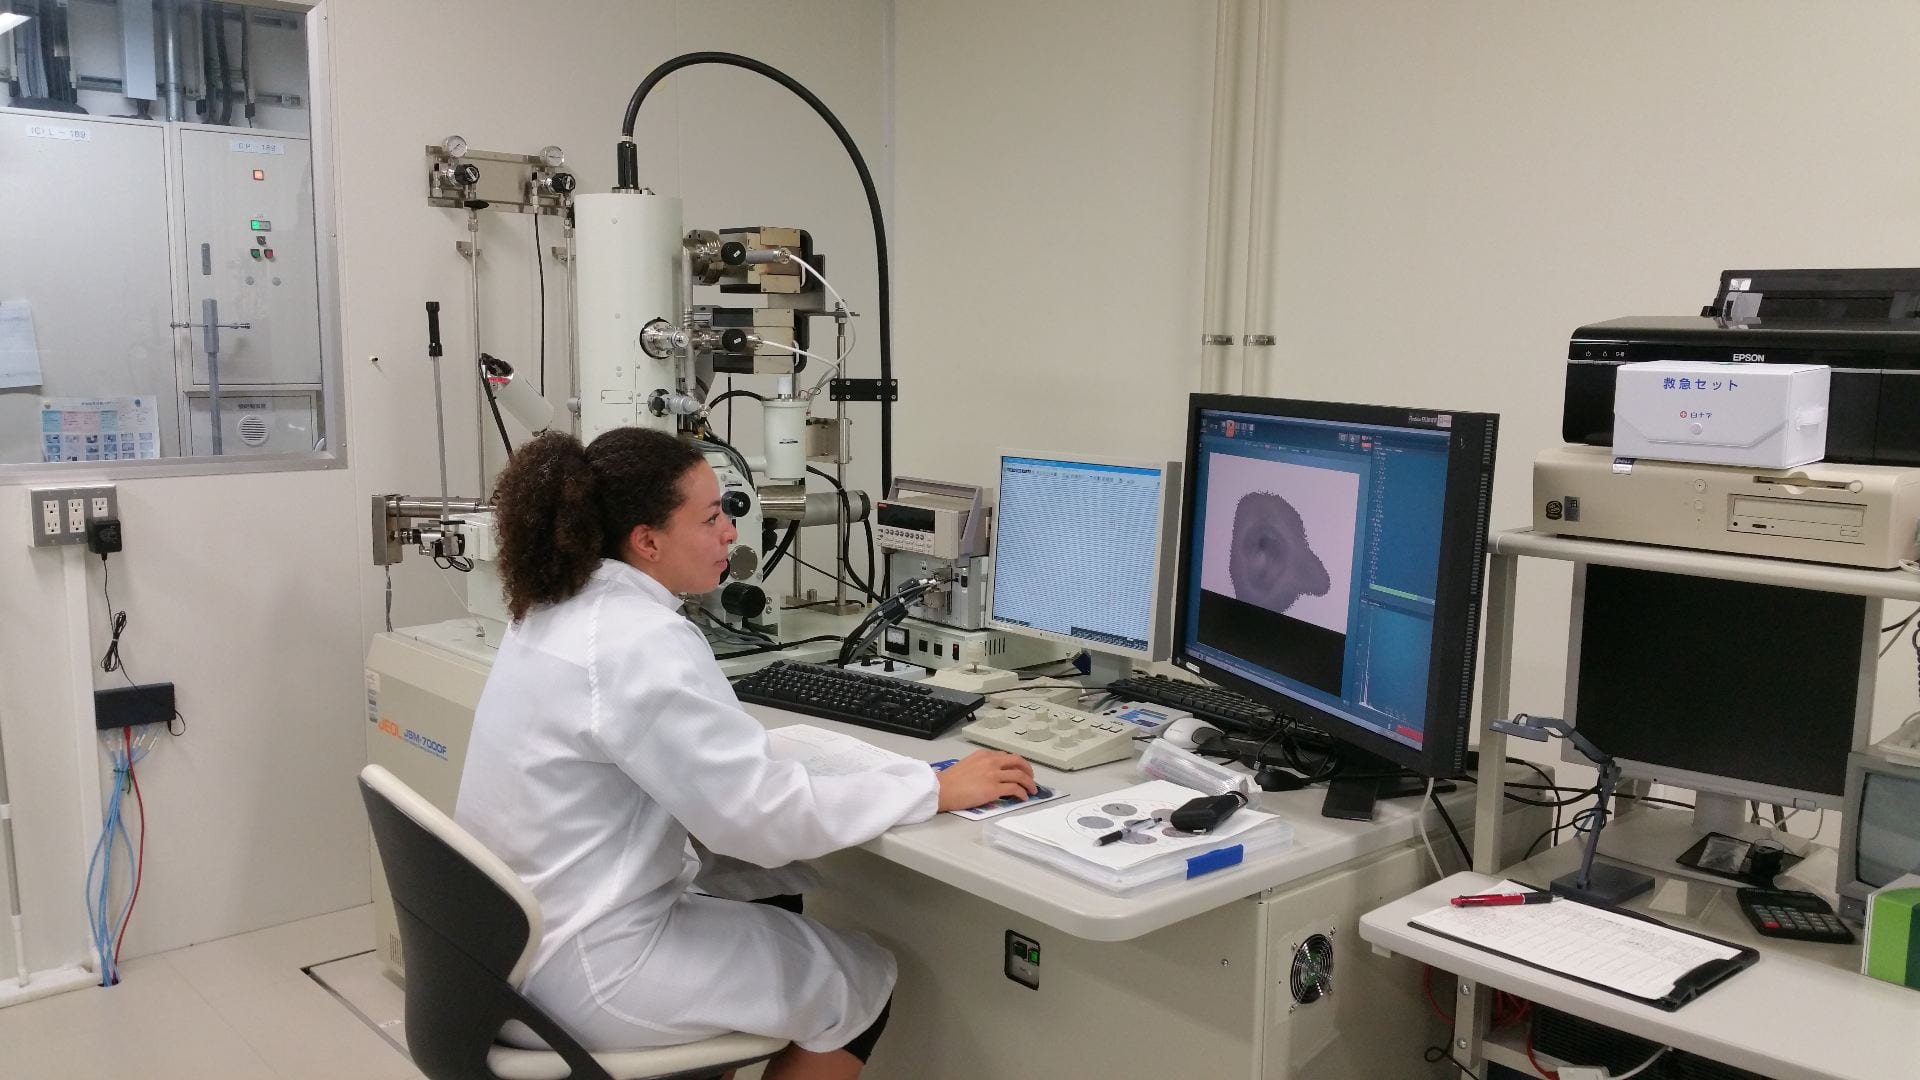
Mai examining each SIMS spot post-analysis to ensure no inclusions were tapped and that fracturing of the sample didn’t occur. This was completed via high-magnification back-scatter electon (BSE) imaging using a JEOL JSM-7000F field-emission scanning electron microscope (FE-SEM).


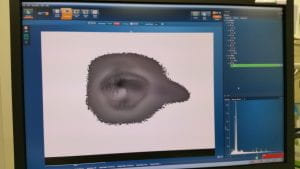
BSE image of a SIMS pit in quartz. Pit is ~20 microns in diameter.

Breaking Breccia: Investigating Hydrothermal Eruptions at Rotokawa

By: Dr. Geoff Lerner

Shane Cronin and Geoff Lerner have been working on learning more about hydrothermal eruptions in the Taupo Volcanic Zone. Over numerous trips to the Rotokawa geothermal field and other nearby geothermal areas, they have observed and sampled the sequence of hydrothermal breccias, looking to recreate the history of steam-driven eruptions in the area. By looking at characteristics of the breccias like grain size, sorting, and composition, they can correlate different breccia outcrops in order to learn about the vent locations of these eruptions and determine the size of these eruptions.

In June and July, Geoff and Shane traveled to Germany to work with colleagues at Ludwig Maximilians University–Munich (including former Auckland VGP postdoc Cristian Montanaro) running experiments on breccia material to determine the conditions under which hydrothermal eruptions take place. In the experiments, sample material from the Rotokawa field is placed in a special chamber (“autoclave”) which can be set to a variety of temperatures and pressures to simulate pre-eruptive conditions. When the chamber is depressurized, a lab-created eruption takes place. This eruption is measured for a number of characteristics and filmed with high-speed cameras so that visual analysis of the eruption in slow motion can be conducted.

View across the steamfield to Mt Tauhara


A small eruption crater in the Rotokawa steamfield


The “Twin Towers”, a bubbling geothermal feature in the steamfield


A section of hydrothermal breccias deposited by eruptions at Rotokawa


Tephra deposits sometimes serve as important marker beds between breccias


Site A-Hole, a hydrothermal feature near the steamfield


Cores from Rotokawa breccia material prepared for experiments in Munich


Preparing the Fragmentation Lab for an experiment


Sample material in the chamber prior to an experiment with the high speed camera looking on


Video of a laboratory eruption of breccia material


The aftermath of a lab eruption


Sampling basalts and rhyolites at Okataina Volcanic Centre

By: David Farsky

PhD student David Farsky, working with Dr. Michael Rowe, completed some fieldwork last weekend. David sampled basaltic scoria from the 1886 Tarawera eruption, basaltic tephra from an older eruption underlying the Rotoiti ignimbrite, pumice from the Rotoiti ignimbrite, and pumice from the Kaharoa ignimbrite.  The pictures with the geothermal lakes and springs show Jimmy, another PhD student, who is looking into the surface expression of the geothermal activity.


David examining Okataina-sourced rhyolitic deposits


A road cut showing block and ash deposits overlain by pumice


Fieldwork discussions with Brad Scott of GNS Science


Sampling K-trig tephra


Checking out the very geothermally active region near Okataina


More geothermal pools


2018 Hawai’i eruption: A real possibility for Auckland residents

By: Sophia Tsang

A year ago today (4 May 2019 (New Zealand time)), a volcanic fissure opened in the Leilani Estates subdivision on Hawai‘i Island (USA). The dramatic footage quick spread across the world, and then like most disasters, was replaced in the news cycle. VGP PhD Candidate Sophia Tsang spent two months on Hawai’i six months after the eruption commenced to learn more.

While people in Hawai‘i reflect on how different their lives have been over the past year, I thought it would be nice to briefly describe the eruption and how it could be similar to future eruptions in Auckland. In the middle of the afternoon, a crack that had appeared in someone’s backyard suddenly began fountaining lava. The sight quickly caught a unmanned aerial system pilot’s attention (see video here), and the world soon knew a new eruption had begun in Hawai‘i. Although many local residents were caught by surprise at the timing of the eruption onset, there were precursory signs that an eruption could occur in the near future. For weeks, there had been an uptick in the number of earthquakes, and lava closer to the volcano’s primary vent had drained. The fire-fountaining fissure had opened in the highest lava hazard zones on Hawai‘i, the eastern rift zone of Kīlauea Volcano and was soon joined by over 20 more fissure friends. The ensuing three month-long eruption held and continues to hold uncertainty for the residents as questions of access and rebuilding remain. Although we generally expect Hawai‘i to be home to an eruption (indeed, it’s been a huge tourist draw for decades), other locations could experience similar events too.

Although it’s hard to imagine, Auckland could experience a very similar eruption in the future. Auckland is situated on top of a volcanic field. A volcanic field is a type of volcano that does not have a central vent, rather there are many vents spread over a large area. Thus, we will have harder time predicting the location of the next eruption, and most of the volcanic field is either underwater or under urban/suburban structures! If you are interested in what an underwater eruption in Auckland may look like and are based in Auckland, I highly recommend that you visit the Auckland Museum’s Volcano House (which has been updated in the past two years!). A similar simulation for an eruption on land has not been created (yet!), so transposing the video above onto an Auckland location in your mind is currently as close as you can get. Hawai‘i Island had a few advantages over Auckland in terms of the vulnerability factors though. First, Leilani Estates has a much lower population density than Auckland does. Thus, an Auckland eruption would likely affect many more people than the eruption in Leilani Estates did. Second, people living in Hawai’i tend to be more aware of their volcanoes and their potential for eruption. If you’d like to learn more about how Auckland could be affected by eruptions, I’d highly recommend you take a look at the Determining Volcanic Risk in Auckland (DEVORA) hypothetical scenarios developed here. Hopefully, those of you living in Auckland will never experience an event similar to the eruption in Leilani Estates (you aren’t likely to!), but just in case, it’s worth learning more about our Pacifica neighbours and their recent eruption.

Taranaki: Beyond Lavadome

By: Geoff Lerner


Over the last few years, I have spent quite a good deal of time doing research on and around Taranaki volcano. From road outcrops along the Surf Highway to river catchments and cliffs inside Egmont National Park to the remains of the volcano’s most recent lava dome at its summit, I collected samples at a wide variety of distances from the volcano in order to evaluate mass flow hazards at Mt. Taranaki


Mt. Taranaki seen from the western side. The remnant dome is at the top of the snowpack, and the large mass to the left of the snowpack is “The Turtle”, a large lava coulee that was part of the most recent dome.


The top of Pyramid Stream in western Egmont National Park. The catchment walls are made up of layers of block-and-ash flow deposits from lava dome collapses.


In order to use paleomagnetic methods in the lab, we needed to collect oriented samples from the field. That means orienting each sample carefully before it was collected, either by drilling small cores with a converted chainsaw drill or by removing pieces of rock and matrix material from pyroclastic flow and lahar deposits.


Orienting hand samples with a compass is a vital step in collecting paleomagnetic samples.


Using a combination of paleomagnetic, geochemical, stratigraphic, radiocarbon, and other methods, I have worked towards a better understanding of the past 1000 years of activity at Mt. Taranaki and what that can teach us about potential future eruptions. We have been able to come up with a detailed sequence of events for this time (called the Maero Eruptive Period), learning that Taranaki has had 11 eruptive episodes over the past 1000 years, with the most recent eruption happening in about 1790 AD.


Our fieldwork team stands in Taranaki’s summit crater at about 2500 m discussing plans to drill paleomagnetic cores.


Exploring the amphitheater left behind in about 1790 AD when Taranaki’s summit lava dome collapsed to the west.


Getting the water cooled, converted-chainsaw drill prepared to take samples from the dome.


Taking notes next to a block of an andesite lava flow near the summit.


The research has also shown that most of Taranaki’s recent activity consisted of hot lava dome growth and collapse, often over very short time intervals. These collapses resulted in high speed, high temperature block-and-ash flows that usually travelled about 5-15 km from the volcano. However, our research also showed that past larger eruptions from Mt. Taranaki have resulted in pyroclastic flows which travelled at least 24 km from the volcano’s summit, significantly farther than ever identified before.

These new results about timing, type, and location of Mt. Taranaki’s recent hazards will have a significant impact on preparation and identification of future hazards at the volcano.


Orienting and collecting samples from pyroclastic flow deposits along Highway 45, about 20 km from the volcano’s summit.


Map showing deposits from Taranaki’s most recent episode (red), past 1000 years (yellow), and deposits from 11,500 years ago farther from the volcano (white). Rings show where pyroclastic flows were thought to have reached before our research, and where we found them.